
counting kangaroos
3.1 Problems with counting kangaroos
There must be some problem with counting kangaroos – every time OEH-NPWS or their consultants do it, they change the methodology. The only really accurate way to count them, it seems, is to shoot them (Hacker et al certainly counted the hell out of 2,755 of them in 2004).
In 1975 an attempt was made to estimate the number of Red Kangaroos within the commercial harvest zones of western NSW via conducting an aerial count, giving a population of 3 365 300 kangaroos in western NSW (DECCW 2009).
From Caughley & Grigg (1981):
This study indicates that extensive aerial survey is a feasible, cheap and precise means of monitoring kangaroo populations in remote areas.
Subsequently, from Short & Grigg (1982):
In each, a standardised technique of aerial survey (Caughley et al 1976; Caughley 1977; Grigg 1979) has been employed.
Techniques included 2 counters on each side of the plane comparing counts from seven second intervals, and including 50 hrs of training for “trainee” observers. CSIRO scientists and university lecturers and researchers were probably capable of doing an adequate job, and the author does not have a problem with the c.2-2.6M Red Kangaroo population estimates in the 1:250,000 mapsheet areas surveyed in the period 1975-1979.
But between 1979 and 1980 something strange happens – the figure increases by 30% in a single year, then by 13%, then by 25%. Over the next 2 years numbers crash by 50% p/a, but then between 1984 and 1985, they miraculously double! That’s a 100% increase! Numbers have since been extremely erratic and increasingly implausible.
The best estimates of population growth for grey kangaroos seem to indicate that 9-11% growth is reasonable under standard conditions (eg: Arnold et al 1991, Banks et al 2000). A 30% increase in one year is given as possible in the wild under exceptionally good seasonal conditions (eg: Strahan 1995), however the only reference to growth rates of 30% (and higher) seem to be “calculated” growth rates, or being referred to population estimates based on aerial survey and application of various “correction factors”, rather than observed population growth rates in detailed (small) population studies in the field.
Where do 100% increases come from? When you consider the data on a zone by zone and species by species basis, it becomes obvious something must be very wrong with the methodologies being applied by OEH and their consultants. Growth rates approaching and over 50% are common in the accounts of kangaroo populations in the Zone by Zone descriptions of species in the DECCW (2009) 2010 Quota Report. Note that a 50% population growth rate requires in a population with M:F parity, that every female successfully rears its young to independence, and no animals die, for 12 months. The more outrageous reported population increases are summarised below, with the more text emphasis signifying even more beyond the realms of outrageous (“RK”, “GK” and “W” below refers to Red Kangaroo, Grey Kangaroo and Wallaroo respectively; KMZ refers to Kangaroo Management Zone):
Applying the most optimistic reproduction rates (0.92 for Red Kangaroos in South Australia according to Pople & Grigg 1999), tripling (between 2000 and 2001) or quadrupling (as was reported to be the case with Grey Kangaroos in KMZ 10 (Coonabarabran) between 1992 and 1993) is ridiculous.
Any reported population growth rates over 20% seem biologically unlikely, however the summary above provides “estimates” which represent serious anomalies in the data set, which are discussed nowhere. 100% population growth rates – higher than can be achieved by feral goats and feral pigs (discussed previously) – are biologically impossible. 270%, 209% and 313% growth rates are patently absurd, yet these figures are not even questioned, much less discarded. Would the researchers think that all the kangaroos had twins perhaps, including the males? Or are these data sets simply invalid? Why have these values never been examined?
Note that the 1992-1993 and 2000-2001 increases correspond with changes to survey methodologies. Given that the 1992-1993 methodology change typically doubled populations, and that the 2000-2001 change did not significantly or uniformly modify estimates, the post-2001 survey methodologies are presumed to include the same “corrections” as the intermediate survey methodologies, in comparison to the pre-1992 methodology.
Lundie-Jenkins et al (undated) discusses the importance of long term kangaroo monitoring programs:
Repetition of surveys at regular intervals to standardised methods [are important] so that long-term trends can be systematically and powerfully explored
But this has not occurred: despite 30 years of survey in NSW, long term trends cannot be “systematically and powerfully explored”, because contemporary surveys apply a “correction factor” to counted animals, and the value of applied “correction factors” (more recently termed “detection probabilities”), and the way correction factors are applied, has changed significantly since the time aerial counts were first conducted.
It is interesting that correction factors are so hard to find. The DEC (2008) “population monitoring report”, despite being the paper that supposedly tells the public all about the kangaroo survey methodology, does not have a handy table showing how correction factors have varied over the years, perhaps because they have uniformly varied upward, and this may be a bit embarrassing for the department, when kangaroo numbers in NSW continue to trend downwards (see below).
Interestingly also with regard to correction factors, from the QLD EPA:
The EPA does not employ correction factors to its aerial surveys for eastern grey kangaroos and common wallaroos as comparisons of ground surveys and aerial surveys concluded that surveys using the helicopter line-transect method were both accurate and precise in determining population densities for both species over a range of habitats, seasons and densities.
In 1998 Pople et al had a go at discussing the accuracy of aerial counts in Queensland, and recommended revised CF’s. Some of the more extreme examples they cited include Southwell's (1989) CF for Wallaroos of 23.3 in ”wooded” habitat (ie: see one Wallaroo, multiply by 23 – this must have enormous error margins, though Southwell didn’t provide any), and their own Eastern Grey Kangaroo CF of 10.18 (+/- 9.14) in “open” habitat at Longreach.
The OEH’s Kangaroo Management Program’s manager Nicole Payne describes how often they have changed the methodology since 2000 (DECC 2008), while Cairns happily applies correction factors in NSW (2007 and 2009) – including a 1.85 correction factor for wallaroos during helicopter surveys. Obviously given the QLD EPA’s position on correction factors, it seems likely that whatever factor Cairns is multiplying observed macropod numbers by in NSW, will be fairly close to the proportion being overestimated in his “calculations”.
In addition to correction factor revisions, survey areas are constantly changing, with animals from new regions being added into the totals, and new species being added to the totals.
Gilroy (1999) briefly describes the varied methodologies applied to the different kangaroo management areas over the years; there are numerous distance and point sampling methodologies to determine population densities; Buckland et al 1993 provides a survey methodology which ACT Parks & Conservation Service applied in their 1995-1997 studies in the ACT. Parks & Conservation had a lot of confidence in this methodology, describing it as “internationally accepted”.
However for whatever reason the NSW OEH and UNE keep making up and refining their own methodologies, and coming up with new “correction factors” (CF in the Table below for “open”, “intermediate” and “wooded” environments). Currently different correction factors are being applied to different species in each broad habitat type (the author’s understanding is that these are based on bioregional factors) in each harvest management zone being surveyed, and temperature has been identified as another factor influencing kangaroo detection.
This combination of circumstances has seen a dramatic increase in kangaroo numbers reported between 1989 and 2002, when kangaroo populations (as reported) apparently peaked – it’s nice to know that according to the OEH, after 200 years of European settlement, kangaroo populations continued to rise into the next millennium. The Table below is from DECCW 2010, with author’s notes.
In 1975 an attempt was made to estimate the number of Red Kangaroos within the commercial harvest zones of western NSW via conducting an aerial count, giving a population of 3 365 300 kangaroos in western NSW (DECCW 2009).
From Caughley & Grigg (1981):
This study indicates that extensive aerial survey is a feasible, cheap and precise means of monitoring kangaroo populations in remote areas.
Subsequently, from Short & Grigg (1982):
In each, a standardised technique of aerial survey (Caughley et al 1976; Caughley 1977; Grigg 1979) has been employed.
Techniques included 2 counters on each side of the plane comparing counts from seven second intervals, and including 50 hrs of training for “trainee” observers. CSIRO scientists and university lecturers and researchers were probably capable of doing an adequate job, and the author does not have a problem with the c.2-2.6M Red Kangaroo population estimates in the 1:250,000 mapsheet areas surveyed in the period 1975-1979.
But between 1979 and 1980 something strange happens – the figure increases by 30% in a single year, then by 13%, then by 25%. Over the next 2 years numbers crash by 50% p/a, but then between 1984 and 1985, they miraculously double! That’s a 100% increase! Numbers have since been extremely erratic and increasingly implausible.
The best estimates of population growth for grey kangaroos seem to indicate that 9-11% growth is reasonable under standard conditions (eg: Arnold et al 1991, Banks et al 2000). A 30% increase in one year is given as possible in the wild under exceptionally good seasonal conditions (eg: Strahan 1995), however the only reference to growth rates of 30% (and higher) seem to be “calculated” growth rates, or being referred to population estimates based on aerial survey and application of various “correction factors”, rather than observed population growth rates in detailed (small) population studies in the field.
Where do 100% increases come from? When you consider the data on a zone by zone and species by species basis, it becomes obvious something must be very wrong with the methodologies being applied by OEH and their consultants. Growth rates approaching and over 50% are common in the accounts of kangaroo populations in the Zone by Zone descriptions of species in the DECCW (2009) 2010 Quota Report. Note that a 50% population growth rate requires in a population with M:F parity, that every female successfully rears its young to independence, and no animals die, for 12 months. The more outrageous reported population increases are summarised below, with the more text emphasis signifying even more beyond the realms of outrageous (“RK”, “GK” and “W” below refers to Red Kangaroo, Grey Kangaroo and Wallaroo respectively; KMZ refers to Kangaroo Management Zone):
- KMZ 1: RK 46% growth 1992-1993; GK 197% growth 1992-1993;
- KMZ 2: RK 55% growth 2000-2001, 58% growth 2003-2004; GK 134% growth 1992-1993, 96% growth 1994-1995;
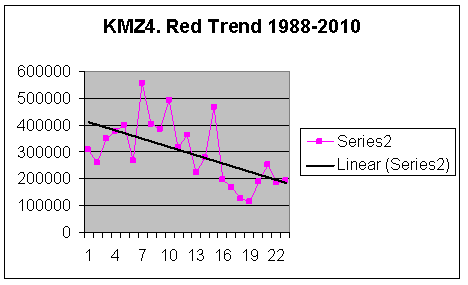
- KMZ 4: RK 107% growth 1993-1994, 68% growth 2001-2002, 66% growth 2006-2007; GK 90% growth 1992-1993, 99% growth 2005-2006, 62% growth 2007-2008;
- KMZ 6: RK 57% growth 1993-1994, 91% growth 1997-1998, 82% growth 2007-2008; GK 92% growth 1992-1993
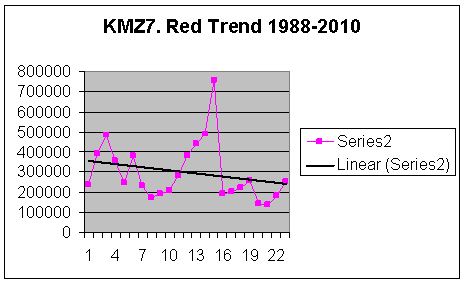
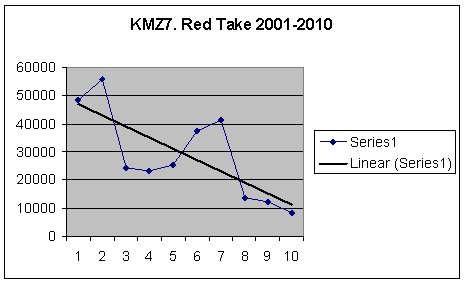
- KMZ 7: RK 64% growth 1988-1989; GK 66% growth 1989-1990, 119% growth 1992-1993, 47% growth 2000-2001, 67% growth 2006-2007
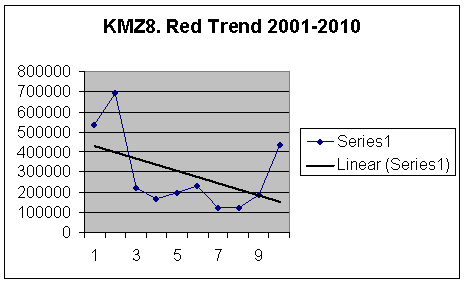
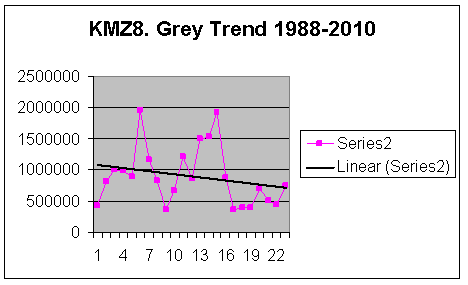
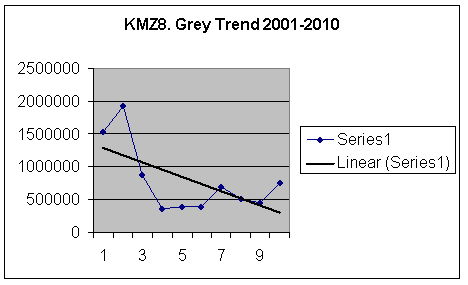
- KMZ 8: RK 62% growth 1988-1989, 170% growth 1992-1993, 127% growth 1996-1997, 270% growth 1997-1998, 82% growth 1999-2000, 51% growth 2008-2009; GK 87% growth 1988-1989, 119% growth 1992-1993, 81% growth 1996-1997 and 1997-1998, 72% growth 1999-2000, 75% growth 2006-2007
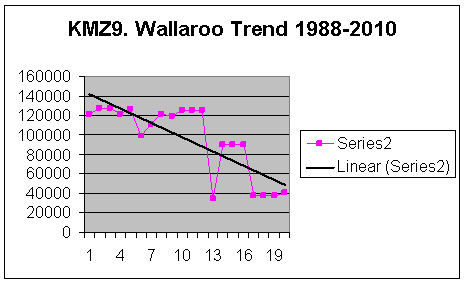
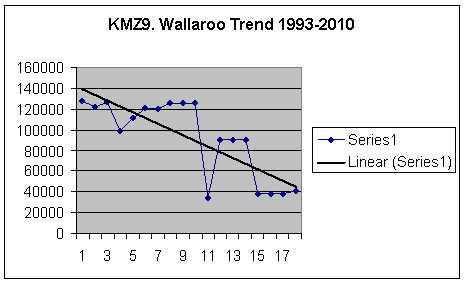
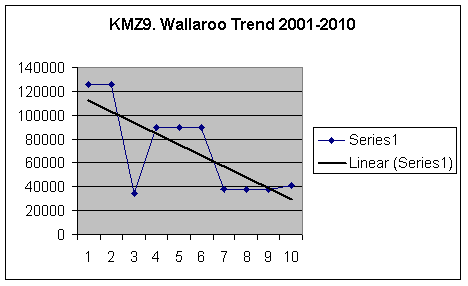
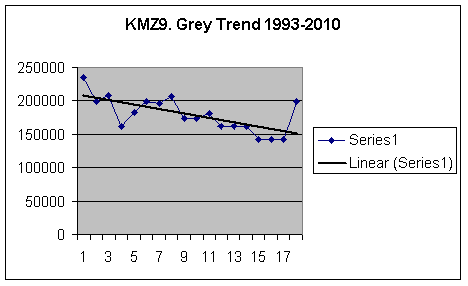
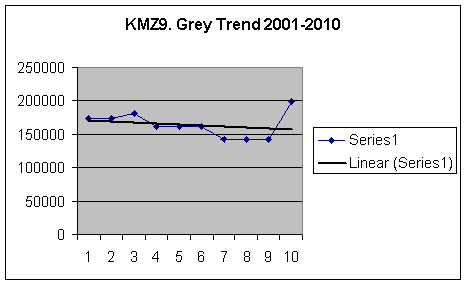
- KMZ 9: W 158% growth 2004-2004 – interestingly a nice recovery as animals were approaching critically low densities of only 2.1 animals per km²
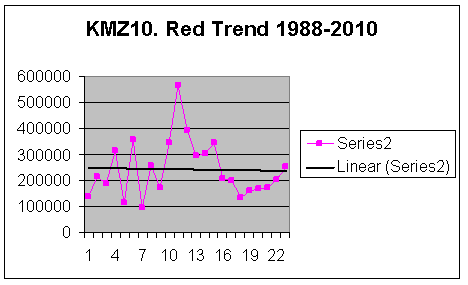
- KMZ 10: RK 57% growth 1988-1999, 68% growth 1990-1991, 209% growth 1992-1993, 167% growth 1994-1995, 102% growth 1996-1997, 65% growth 1997-1998; GK 55% growth 1988-1989, 313% growth 1992-1993, 45% growth 2001-2002, 54% growth 2002-2003
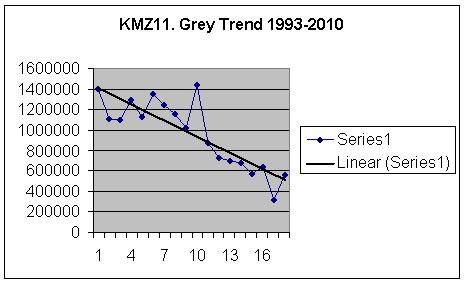
- KMZ 11: RK 47% growth 1991-1992, 80% growth 1995-1996, 102% growth 1998-1999; GK 57% growth 1988-1989, 109% growth 1992-1993
- KMZ 13: W 72% growth 2000-2001; GK 58% growth 2006-2007
Applying the most optimistic reproduction rates (0.92 for Red Kangaroos in South Australia according to Pople & Grigg 1999), tripling (between 2000 and 2001) or quadrupling (as was reported to be the case with Grey Kangaroos in KMZ 10 (Coonabarabran) between 1992 and 1993) is ridiculous.
Any reported population growth rates over 20% seem biologically unlikely, however the summary above provides “estimates” which represent serious anomalies in the data set, which are discussed nowhere. 100% population growth rates – higher than can be achieved by feral goats and feral pigs (discussed previously) – are biologically impossible. 270%, 209% and 313% growth rates are patently absurd, yet these figures are not even questioned, much less discarded. Would the researchers think that all the kangaroos had twins perhaps, including the males? Or are these data sets simply invalid? Why have these values never been examined?
Note that the 1992-1993 and 2000-2001 increases correspond with changes to survey methodologies. Given that the 1992-1993 methodology change typically doubled populations, and that the 2000-2001 change did not significantly or uniformly modify estimates, the post-2001 survey methodologies are presumed to include the same “corrections” as the intermediate survey methodologies, in comparison to the pre-1992 methodology.
Lundie-Jenkins et al (undated) discusses the importance of long term kangaroo monitoring programs:
Repetition of surveys at regular intervals to standardised methods [are important] so that long-term trends can be systematically and powerfully explored
But this has not occurred: despite 30 years of survey in NSW, long term trends cannot be “systematically and powerfully explored”, because contemporary surveys apply a “correction factor” to counted animals, and the value of applied “correction factors” (more recently termed “detection probabilities”), and the way correction factors are applied, has changed significantly since the time aerial counts were first conducted.
It is interesting that correction factors are so hard to find. The DEC (2008) “population monitoring report”, despite being the paper that supposedly tells the public all about the kangaroo survey methodology, does not have a handy table showing how correction factors have varied over the years, perhaps because they have uniformly varied upward, and this may be a bit embarrassing for the department, when kangaroo numbers in NSW continue to trend downwards (see below).
Interestingly also with regard to correction factors, from the QLD EPA:
The EPA does not employ correction factors to its aerial surveys for eastern grey kangaroos and common wallaroos as comparisons of ground surveys and aerial surveys concluded that surveys using the helicopter line-transect method were both accurate and precise in determining population densities for both species over a range of habitats, seasons and densities.
In 1998 Pople et al had a go at discussing the accuracy of aerial counts in Queensland, and recommended revised CF’s. Some of the more extreme examples they cited include Southwell's (1989) CF for Wallaroos of 23.3 in ”wooded” habitat (ie: see one Wallaroo, multiply by 23 – this must have enormous error margins, though Southwell didn’t provide any), and their own Eastern Grey Kangaroo CF of 10.18 (+/- 9.14) in “open” habitat at Longreach.
The OEH’s Kangaroo Management Program’s manager Nicole Payne describes how often they have changed the methodology since 2000 (DECC 2008), while Cairns happily applies correction factors in NSW (2007 and 2009) – including a 1.85 correction factor for wallaroos during helicopter surveys. Obviously given the QLD EPA’s position on correction factors, it seems likely that whatever factor Cairns is multiplying observed macropod numbers by in NSW, will be fairly close to the proportion being overestimated in his “calculations”.
In addition to correction factor revisions, survey areas are constantly changing, with animals from new regions being added into the totals, and new species being added to the totals.
Gilroy (1999) briefly describes the varied methodologies applied to the different kangaroo management areas over the years; there are numerous distance and point sampling methodologies to determine population densities; Buckland et al 1993 provides a survey methodology which ACT Parks & Conservation Service applied in their 1995-1997 studies in the ACT. Parks & Conservation had a lot of confidence in this methodology, describing it as “internationally accepted”.
However for whatever reason the NSW OEH and UNE keep making up and refining their own methodologies, and coming up with new “correction factors” (CF in the Table below for “open”, “intermediate” and “wooded” environments). Currently different correction factors are being applied to different species in each broad habitat type (the author’s understanding is that these are based on bioregional factors) in each harvest management zone being surveyed, and temperature has been identified as another factor influencing kangaroo detection.
This combination of circumstances has seen a dramatic increase in kangaroo numbers reported between 1989 and 2002, when kangaroo populations (as reported) apparently peaked – it’s nice to know that according to the OEH, after 200 years of European settlement, kangaroo populations continued to rise into the next millennium. The Table below is from DECCW 2010, with author’s notes.
Kangaroos in the commercial harvest zones of NSW
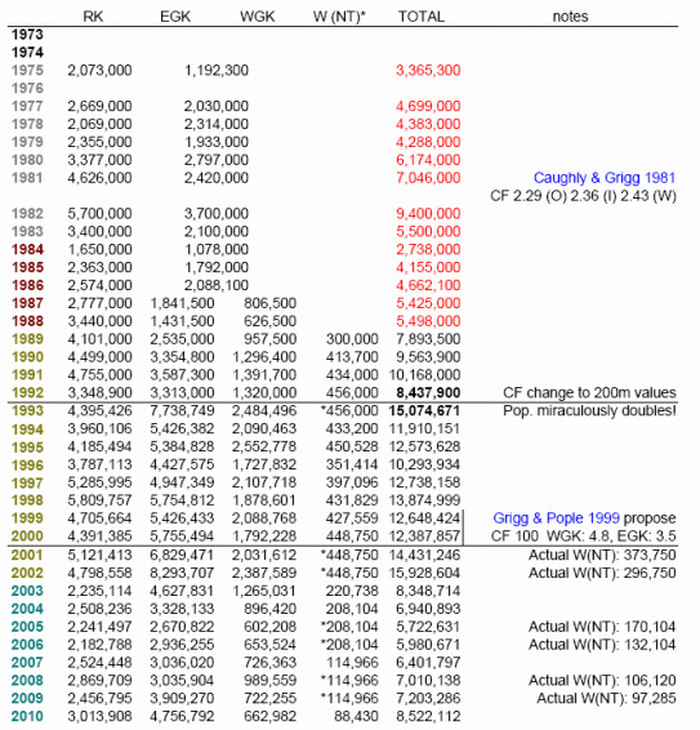
* indicates OEH estimates for Wallaroos in the Northern Tablelands KMZ based on the previous survey; this nomination estimates numbers of Wallaroos (W) in the Northern Tablelands (NT) in the right hand column, based on counts from surveys in 2000, 2003, 2007 and 2010, and observable trends in the data provided.
Note 1: OEH Tables go back to 1973, but they provide no data for the years 1973 or 1974.
Note 2: Grey kangaroo numbers for 1975-1986 were obtained by subtracting the Red Kangaroos from the Total Kangaroos provided – no data on Eastern vs Western Grey Kangaroos are provided by the department.
Note 3: Totals in the table above are from harvest zones only. These numbers are not OEH’s estimates for kangaroo numbers in NSW (the OEH does not have a state-wide estimate)
Note 4: Coloured dates represent estimates based on differing survey areas, being: 1975-1983 seven 1:250 000 mapsheet monitoring blocks, 1984-1988 Western Plains of NSW, 1989-2002 Western Plains + Northern Tablelands and 2003-2009 Western Plains + Central & Northern Tablelands + South-east Australia (KMZ).
Refer also to DECCW 2009 and DECCW 2010.
This is the data which is constantly referred to as providing that kangaroo management is appropriate, and that the harvest as a component in kangaroo management, is sustainable (most recently in Cooney et al 2011 – their much cited “Figure 1”, on which their whole basis in argument seemed to reside).
Herbert & Elzer (2011) make the point that even with 30 years of “research”, the ever changing methodology (sorry, the ever “improving” methodology), means that there is no data continuity (“… it is not possible to draw conclusions about the underlying population size using the graphs in Figure 1”). We simply cannot graph kangaroo population totals, because of changed correction factors, and additional areas (and additional kangaroos) being constantly added to population totals, as new harvest zones come on-line.
It is not only these factors that make it hard to graph kangaroos however – it is the fact that each survey area is divided into unknown proportions of various habitat types based on bio-physical attributes (and therefore CF factors are applied variably across each KMZ). None of the raw data is provided in publicly available reports on kangaroo monitoring (apart from the Cairns reports for the Northern Tablelands (2007) and the Hunter & Central Tablelands (2009) – these are discussed later), and it is therefore impossible to replicate survey methodologies, it is impossible to re-analyse or re-interpret the data, and it is impossible to critique the methodologies and analyses performed by the various researchers.
This goes against everything that science is supposed to be about.
Nonetheless even this atrocious data set provides very ominous signs. Total NSW kangaroos (within the harvest zones) have halved, according to DECCW, between 2001 and 2010, while the data includes additional totals from the new South-east NSW (in 2004) and Central Tablelands (in 2009) kangaroo harvest zones.
Pay attention on the following pages to the trendlines, and keep in mind that this is given by the regulators and the harvest industry as “sustainable management”.
3.2 Trajectories
There have been reported “increases in abundance” of kangaroos (Newscome 1965 and Caughly et al 1980); various authors other than these have attempted to explain why this may have occurred (such as James et al 1998), putting forward theories such as “lack of dingos”, “no Aboriginal hunting”, “improved water” or “more grasslands” (these theories are discussed elsewhere in this nomination).
However if you look at the data, the only trends being shown are downward.
It’s a bit of a catch-cry by the researchers, that you can’t graph long term kangaroo populations because of varying survey methodologies over the years. However you can graph populations in each of the harvest zones, which provides at least standardised survey areas.
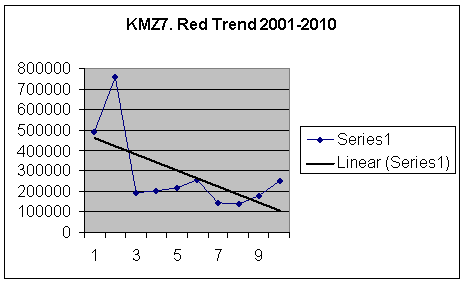
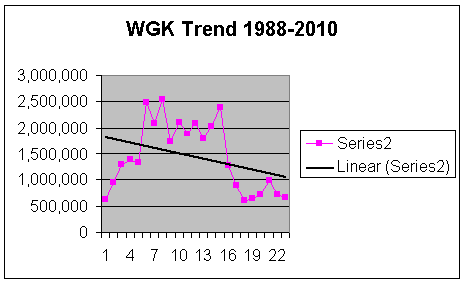
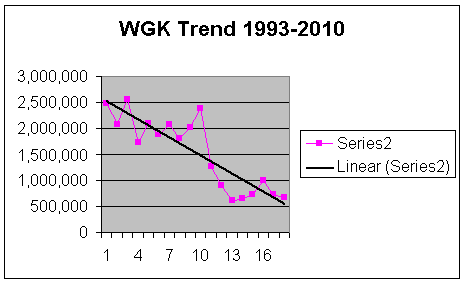
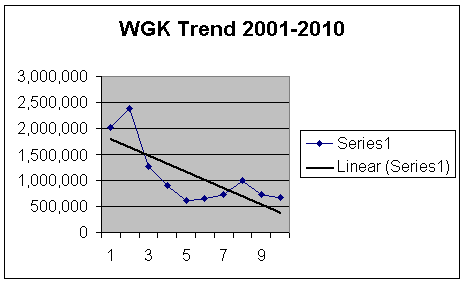
The following graphs are based on data 1988-2010 from the 2011 Kangaroo Quota Report New South Wales (DECCW 2010).
3 graphs are shown for each data set, being 1988-2010 (complete 2010 Quota Report data sets); 1993-2010 (dropping off unreliable “old” methodology data, but using CF 200 for the first half of the data set) and; 2001-2010 (using only the best and most up-to-date CF 100 correction factors and survey methodologies). If 10 years does not provide enough data continuity to get an idea of kangaroo trajectories, then we might as well give up on wildlife management, or at least give up on the organisations and consultants responsible for the monitoring and management of these species.
However if you look at the data, the only trends being shown are downward.
It’s a bit of a catch-cry by the researchers, that you can’t graph long term kangaroo populations because of varying survey methodologies over the years. However you can graph populations in each of the harvest zones, which provides at least standardised survey areas.
The following graphs are based on data 1988-2010 from the 2011 Kangaroo Quota Report New South Wales (DECCW 2010).
3 graphs are shown for each data set, being 1988-2010 (complete 2010 Quota Report data sets); 1993-2010 (dropping off unreliable “old” methodology data, but using CF 200 for the first half of the data set) and; 2001-2010 (using only the best and most up-to-date CF 100 correction factors and survey methodologies). If 10 years does not provide enough data continuity to get an idea of kangaroo trajectories, then we might as well give up on wildlife management, or at least give up on the organisations and consultants responsible for the monitoring and management of these species.
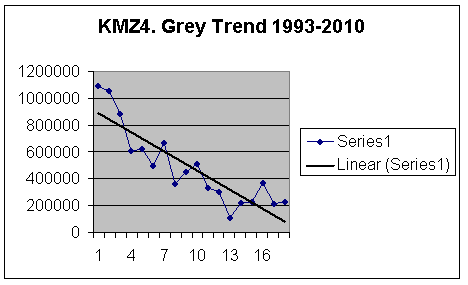
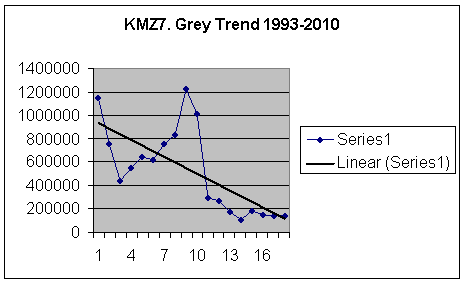
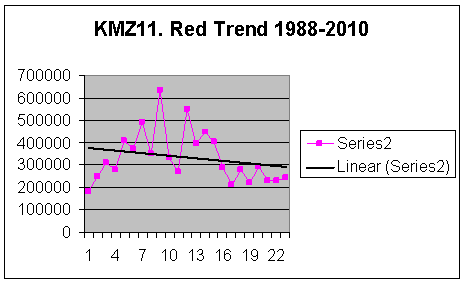
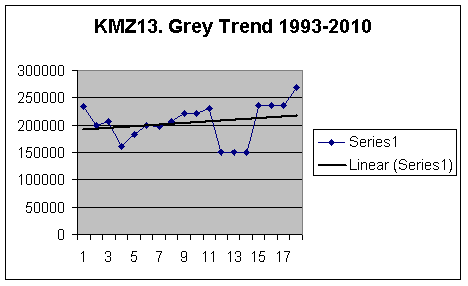
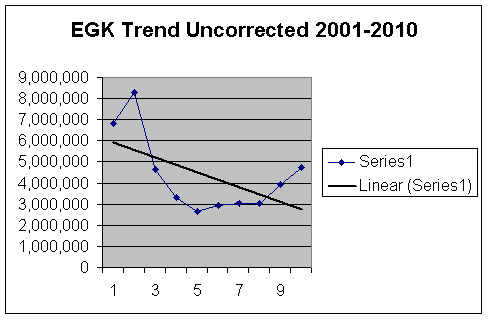
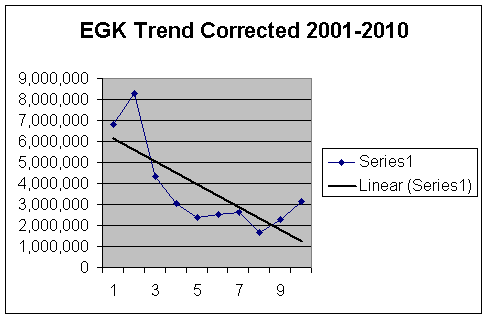
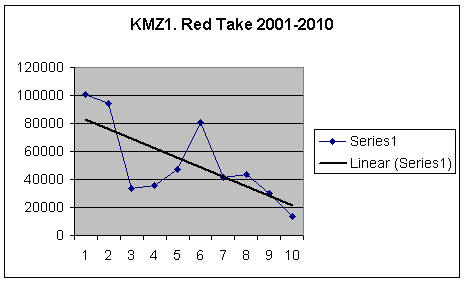
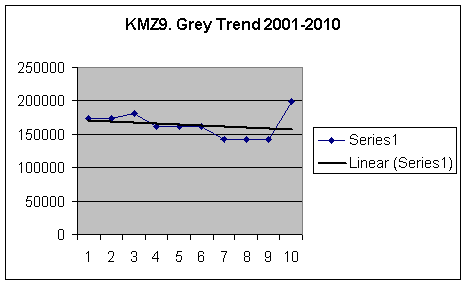
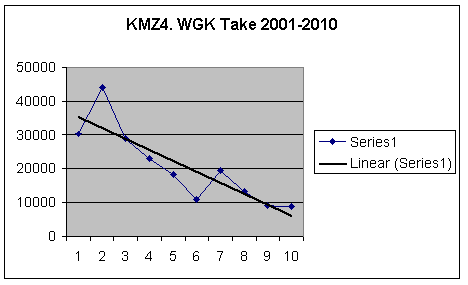
Zone 1. Tibooburra

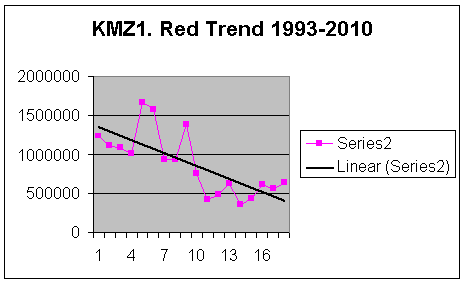
The Red Kangaroo population at Tibooburra has been more than halved since 2001. Does a 55% decrease and a downward trendline across all time-frames indicate a sustainable harvest?
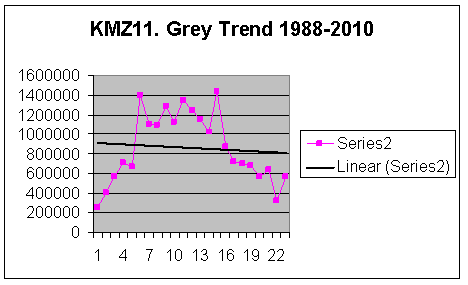
Perhaps the Grey Kangaroos are doing better out there...
Perhaps the Grey Kangaroos are doing better out there...
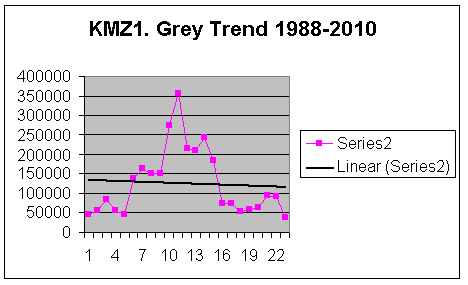
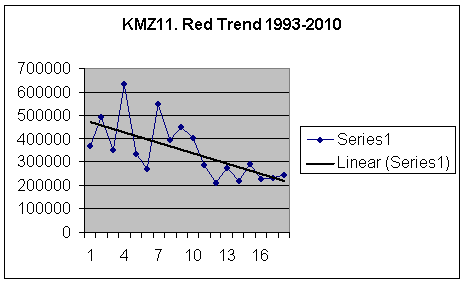
That looks OK! Let’s drop off the bad pre-1993 data and see what happens…
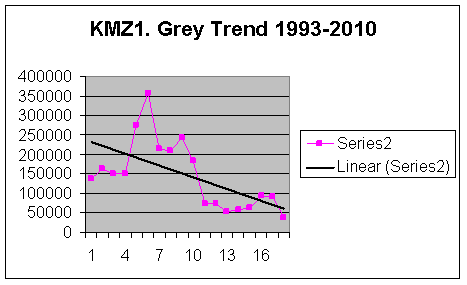
For the purposes of this nomination, the author has simply used trendlines to indicate trajectories - a down-sloping trend-line does not indicate a sustainable management program. The count “data” that has been provided contains so many errors and inconsistencies (and large confidence intervals), that for managers to claim that the population monitoring “tracks” the populations is ludicrous; a trendline may be “truer”.
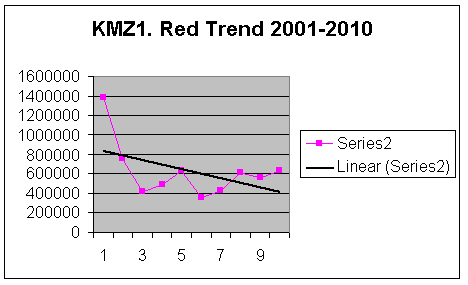
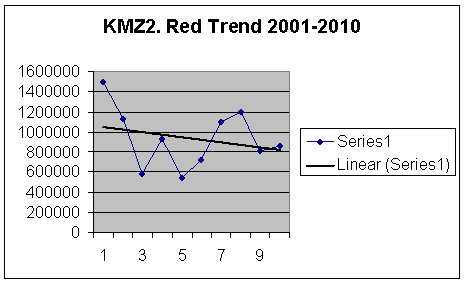
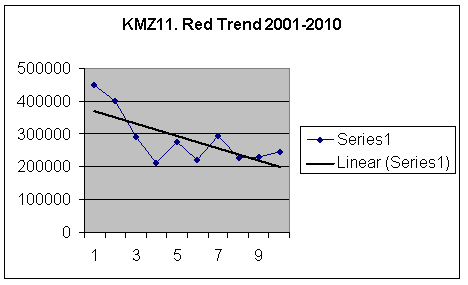
Now let’s look at the “good” data set (2001-2010).
Now let’s look at the “good” data set (2001-2010).
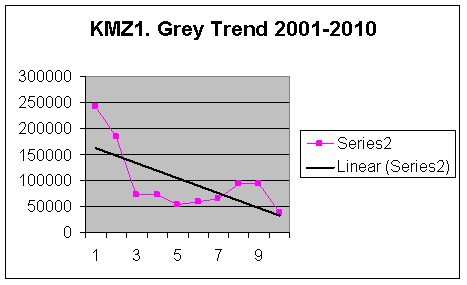
GK had been reduced by 85% since 2001 in KMZ1. Everyone says “its drought”.
That is: Grey Kangaroos have been reduced to 15% of their population from 10 years ago, under the OEH “sustainable” management program. The OEH have kindly stopped the shooting at Tibooburra for 2011 (DECCW 2010) - it’s good to see they are on the ball.
That is: Grey Kangaroos have been reduced to 15% of their population from 10 years ago, under the OEH “sustainable” management program. The OEH have kindly stopped the shooting at Tibooburra for 2011 (DECCW 2010) - it’s good to see they are on the ball.
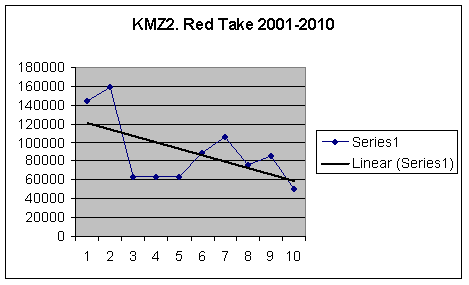
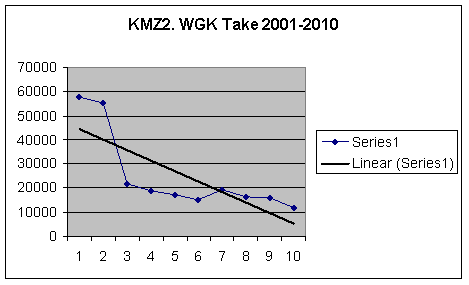
Zone 2. Broken Hill
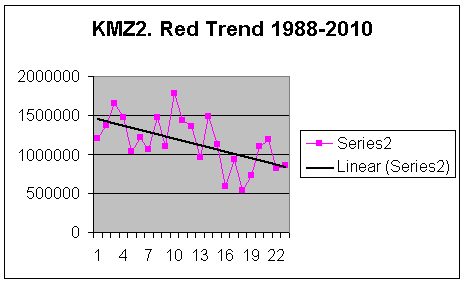
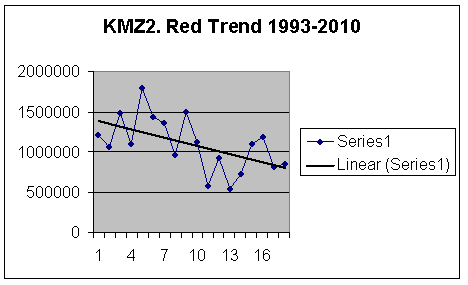
After crashing by 60% in only 2 years (2001-2003 – surprisingly this did not ring any alarm bells with the regulators), Red Kangaroos have “recovered” at Broken Hill, being in 2010 approximately 50% of the population from 10 years previously.
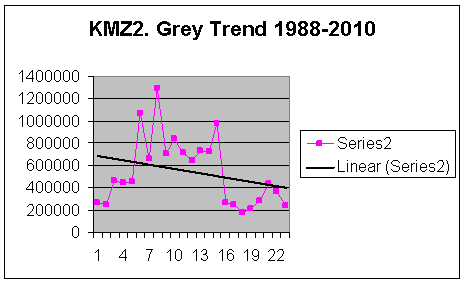
Let’s drop the poor pre-1993 data, which if correct would have indicated the population more than doubled between 1992 and 1993 (a biological impossibility).
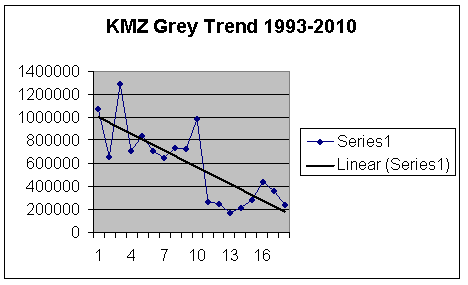
The 1993-2000 data is so unreliable, that we can ignore the older data (including the highest peak in the graph above), otherwise grey kangaroos in the Broken Hill district would have declined by 81% between 1995 and 2010.
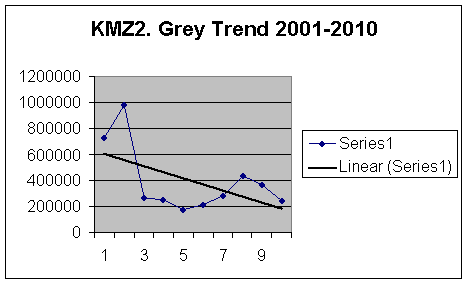
Grey Kangaroos have been reduced by 75% since 2002 in the Broken Hill district.
Shooting of Western Grey Kangaroos has been stopped for 2011 in KMZ2, however kangaroo management planning documents do not provide details on how Western Grey Kangaroos are doing at Broken Hill, compared to Eastern Grey Kangaroos. The situation at Narrabri (below) does not provide any confidence that the conservation of either of the grey kangaroo species at Broken Hill is assured.
Shooting of Western Grey Kangaroos has been stopped for 2011 in KMZ2, however kangaroo management planning documents do not provide details on how Western Grey Kangaroos are doing at Broken Hill, compared to Eastern Grey Kangaroos. The situation at Narrabri (below) does not provide any confidence that the conservation of either of the grey kangaroo species at Broken Hill is assured.
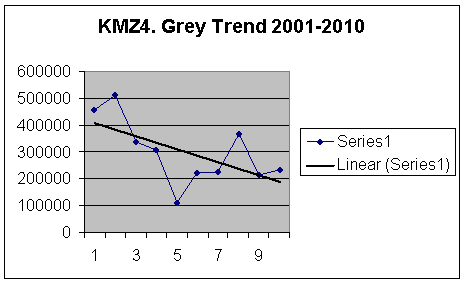
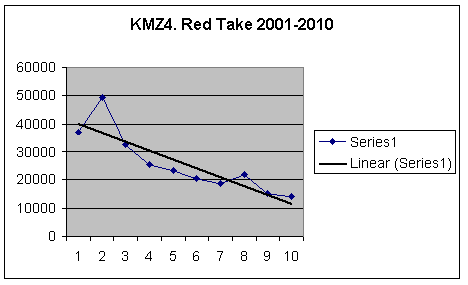
Zone 4. Lower Darling
Once again, we can drop off the dodgy pre-1993 data, which was described by everyone as “conservative”, and as “under-estimating” kangaroo densities. Note that if the early population estimates were under-estimates (and pops were higher), these trend-lines would be even steeper.
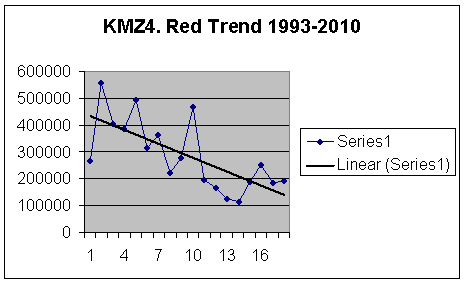
Again, it’s lucky the 1993-2002 data was so poor, otherwise between 1995 and 2010 the population would have declined by 65%. As the 200CF methodology has been abandoned, we can look at the 2001-2009 data as a continuous methodology and a robust data set…
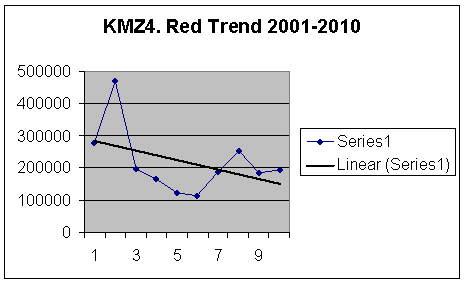
The best survey data that the OEH can afford provides that Red Kangaroos have been reduced by 59% since 2002; no doubt managers will claim this is a result of drought. However even if it is drought, and populations have plummeted, why does the shooting continue?
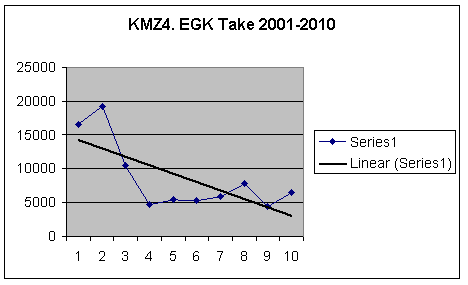
How are grey kangaroos doing?
How are grey kangaroos doing?
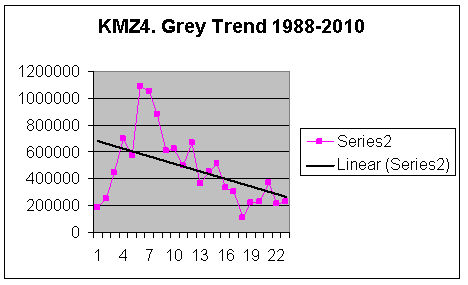
The poor pre-1993 data is a bit annoying – if it is not robust, it should be abandoned, rather than being wheeled out by the OEH and the kangaroo industry every time they want to demonstrate how well kangaroo populations do when you shoot them. It really does create the impression that populations were increasing between 1988 and 1993, which is just a little bit misleading.
Note these graphs are based on OEH’s own figures. If the 1993-2000 data was “good” data, this graph would show grey kangaroos declining by 79% between 1993 and 2010 in the Lower Darling KMZ. Fortunately the 1993-2000 data was based on a poor methodology, and we can rely on the following graph as an indication of how grey kangaroos are faring in this KMZ.
In the period covered by the “best” methodology and most accurate correction factors that the OEH and their consultants can devise, grey kangaroos crashed by 79% in the first few years (between 2002 and 2005). No alarm bells rang, the population miraculously and impossibly doubled (a 100% increase in one year requires all does to successfully rear twins, and no deaths in adult cohorts). They have recovered a little bit since (as reported), seeming fairly stable now, at less than half of what there were 10 years ago.
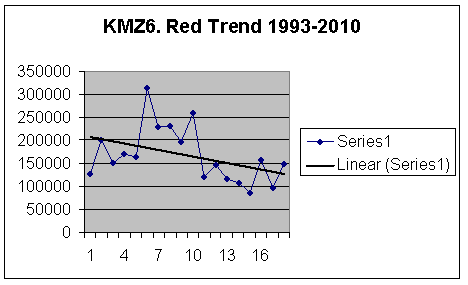
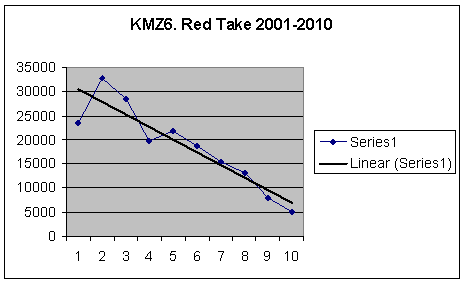
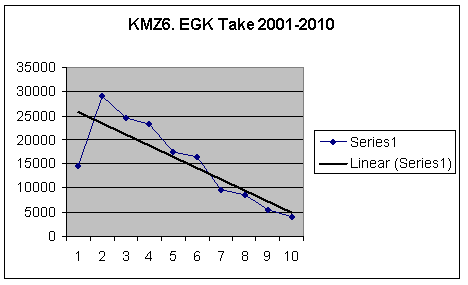
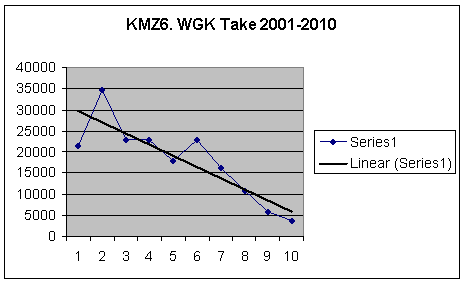
Zone 6. Cobar
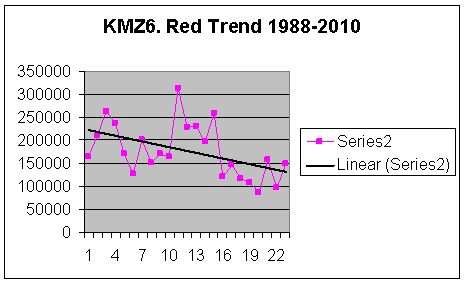
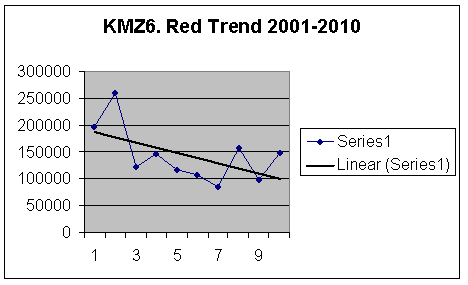
The “current” data set (2001-2010) clearly provides the lowest population totals for Red Kangaroos since entire zones started to be surveyed.
The second graph shows a decline of 73% between 1998 and 2007 – don’t worry! The “good” data shows a decline since 2002 to only 57% of the 2002 numbers, if you can believe that the population increased by 51% between 2009 and 2010 (another biological impossibility – see previous).
The second graph shows a decline of 73% between 1998 and 2007 – don’t worry! The “good” data shows a decline since 2002 to only 57% of the 2002 numbers, if you can believe that the population increased by 51% between 2009 and 2010 (another biological impossibility – see previous).
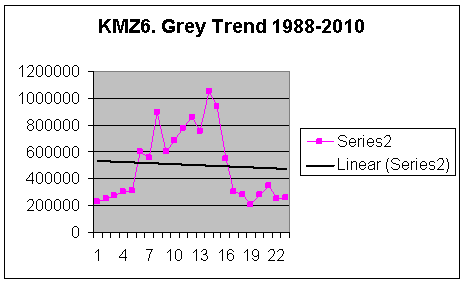
Again the “bad” pre-1993 data gives the impression that the population was building strongly in the early days – these were the sort of figures that provided the impetus for quotas of 17% to be adopted (we shoot heaps, and the population continues to grow!). Get rid of the dodgy data and it doesn’t look so sustainable…
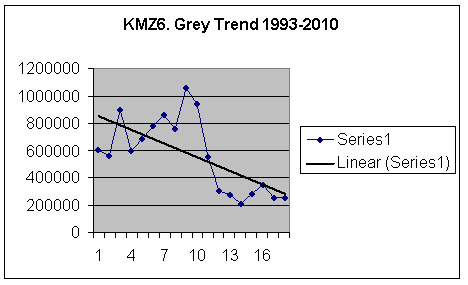
And if you get rid of the CF200 data (1993-2000), you end up with…
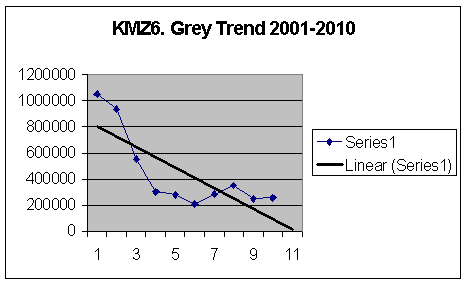
…an 80% reduction between 2001 and 2006! This is clearly a sustainable industry at its most sustainable. A 15% quota continues to be allocated for grey kangaroos at Cobar…
Zone 7. Bourke
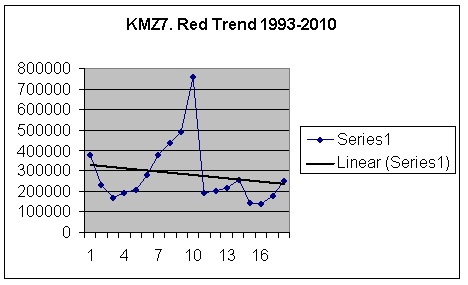
The reader would agree this is looking bad. Red Kangaroos crashed in KMZ 7 from 756,705 to only 191,581 between 2002 and 2003 (75% depletion in a single year). “Managers” responded by increasing the quota from 15% to 17%.
Just to maintain a uniform style to this commentary, the graph above represents a decline of 67% in Red Kangaroos, since 2002. Every time this is said, I hear the cry “it’s drought” – there is only one response to this: “how do you know? And if so, surely you should stop shooting?”
In 1988 - 2010...
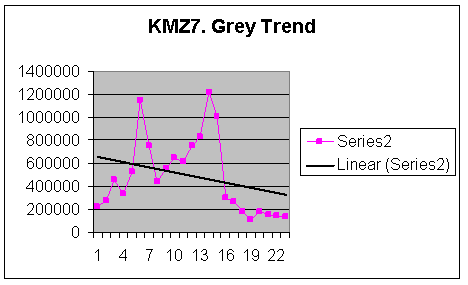
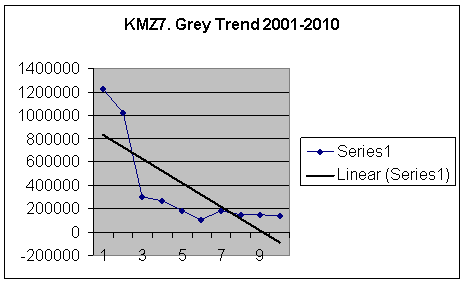
This can’t be right – that trend line is indicating that grey kangaroos should be extinct at Bourke!
Since 2001 grey kangaroos have declined by 89% in this KMZ, including a crash of 70% between 2002 and 2003, according to the best survey methodology available, and the most refined correction factors that OEH and their consultants can devise.
The OEH have not provided a quota for Western Grey Kangaroos in this harvest zone for 2011. However no information on proportions of grey kangaroos is provided in the OEH kangaroo management reports for the Bourke “management” area and Eastern Greys will be shot, so it is hard to see how Western, or either, grey kangaroo species is going to persist, if shooters can’t tell the difference between the species (see Narrabri below).
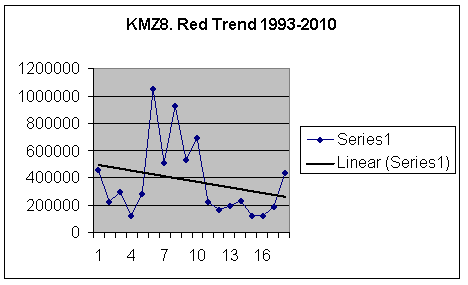
Zone 8. Narrabri
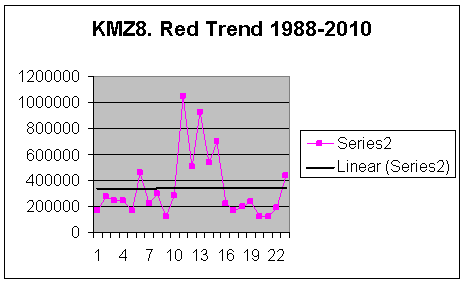
This graph suggests a nice level trendline, which is what you would expect from a sustainable harvest industry. Let’s drop that dodgy pre-1993 data and see what happens though…
In line with the trends elsewhere, Red Kangaroos are declining at Narrabri after all!
Can anyone explain what happened between 1997 and 1998, when the population increased almost four-fold? Are there any kangaroo researchers out there who can explain to me – an ecologist with no experience in kangaroo research and management at all, how this population increased by 269% in a single year? It is frankly incredible that people calling themselves “researchers” would release this sort of rubbish as “data”.
Obviously the best thing we can do is ditch the dodgy 1993-2000 data…
That leaves us with only a very short data set, which still retains some pretty amazing biological facts. Firstly the population crashed by 82% between 2002 and 2007 (a fine example of a sustainable industry – shooting continued); the “good” data finishes with the population more than doubling between 2009 and 2010 (with an unlikely 129% increase). Is this believable?
This is the sort of up-and-down graph the rusted-on researchers, the kangaroo meat industry, and the kangaroo “managers” (OEH) love. From Herbert & Elzer (2011):
The variation in population each year reflects natural fluctuations in kangaroo abundance, which are most often linked with variations in rainfall…
I’m not going to discuss anomalous doubling every time it appears in the data. It is becoming a bit monotonous, but let’s see what happens when we dump the poor pre-1993 data…

…and then let’s dump the CF200 data (1993-2000)…
Grey Kangaroos at Narrabri: down by 77% between 2002 and 2009.
If you can believe an increase of 68% between 2009-2010 (coincidentally close to Griggs calculated Red Kangaroo population growth rate of 63%) Grey Kangaroos at Narrabri are now at 39% of their 2002 population.
How are Western Grey Kangaroos faring at Narrabri? In 2010 a “small” population of this species was reported there (650 animals) – such a small population cannot be sustainably harvested for a major commercial industry (1M animals reported as shot annually in NSW), so no Western Grey Kangaroos were allocated to the quota in this management zone.
The author wondered how reliably a shooter can differentiate between the Western and Eastern Greys, by spotlight, at distance. After reading the 2011 quota report, the author figured they can’t tell the difference, because now there are only 433 Western Grey Kangaroos in the Narrabri KMZ. Unless the OEH can suggest an alternative explanation for the 1/3 decline of this species in a 1 year period, I would suggest that the “trained” shooters really could not care less what they shoot, so long as they get paid.
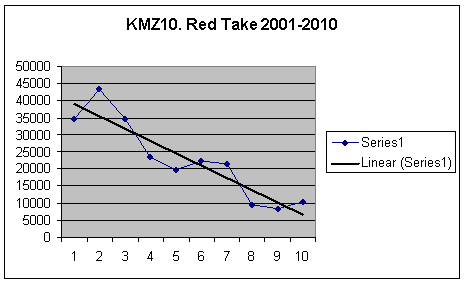
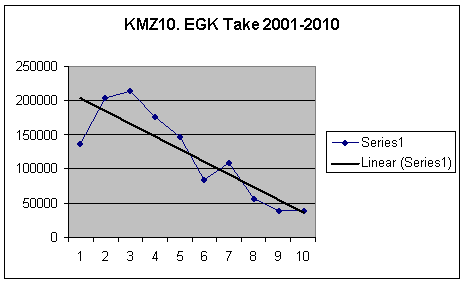
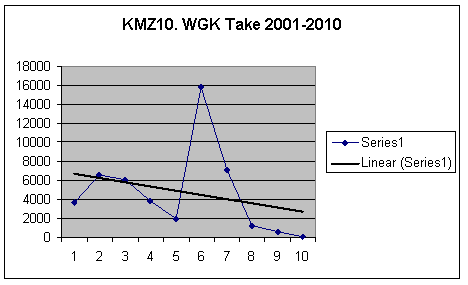
Zone 10. Coonabarabran
A nice level trendline, which is what the industry wants to see. Dump the pre-1993 data…
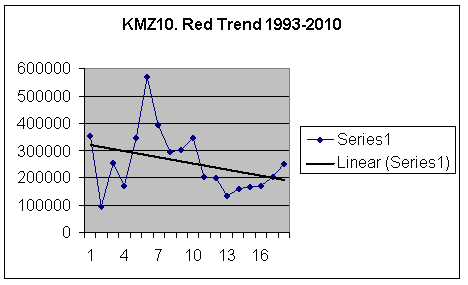
That’s better, but still not good enough. Let’s get rid of the CF200 data (1993-2000), which methodology Cairns and Gilroy (2001) said was under-estimating numbers and densities anyway. Suggesting the “high” of 1998 (nearly 600,000 animals) was an under-estimate, provides that the gradient of the trendline in the graph below, should be steeper.
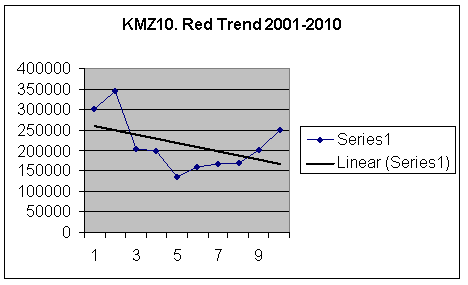
A steep decline between 2002 and 2005 (a 61% decrease), then a levelling (during the “drought”), and then steady growth between 2008 and 2010. Looks like it’s all coming up roses for Red Kangaroos at Coonabarabran!

Another nice level trendline, when we look at data 1988-2010.
I don’t think anyone will be surprised what happens when we dump the pre-1993 data though, the reader may have seen enough of these by now to be getting the idea…
I don’t think anyone will be surprised what happens when we dump the pre-1993 data though, the reader may have seen enough of these by now to be getting the idea…
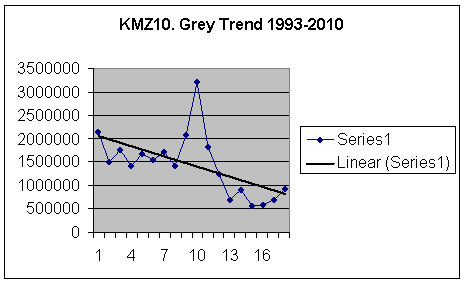
Maybe they’re not doing so well. Let’s dump the dodgy CF200 data too…
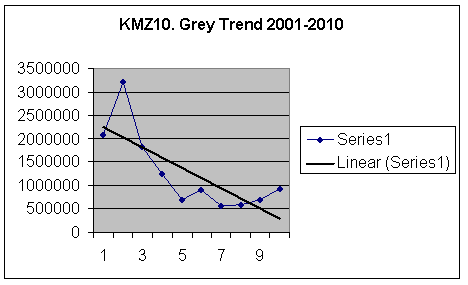
Grey Kangaroos at Coonabarabran declined by 82% between 2002 and 2007. Rebuilding to nearly 1M animals in 2010 could be considered to be an improvement, if it were not for the fact that this remains not even 30% of the 2002 population.
Zone 11. Griffith
I like this graph. The wildly fluctuating variation in the population between 1993 and 2000 is very indicative of a poor or erratic survey methodology, or an analysis with very wide confidence limits. While populations may “boom” and “bust”, they generally do so smoothly, and for large mammals with a low reproductive rate, slowly (generally over a period of years, in response to prolonged good conditions). “Busts” can be dramatic (for example, when a catastrophic event has a widespread impact on a species or population, like we are likely to experience with climate change, and a burgeoning human population).
This being the case there is only really one thing that can be done with the CF200 data (1993-2000)…
This being the case there is only really one thing that can be done with the CF200 data (1993-2000)…
Roughly half left in 10 years. Even if the population has stabilised as indicated by the data, is this good management? Let’s see next years data, when in response to this criticism, all of the populations being monitoring are expected by the author of this nomination to have a positive bounce, perhaps >100% or so, on account of rainfall and good conditions.
That’s a 77% reduction in population between 1993 and 2009, if the 1993-2000 CF200 methodology and correction factors are valid…
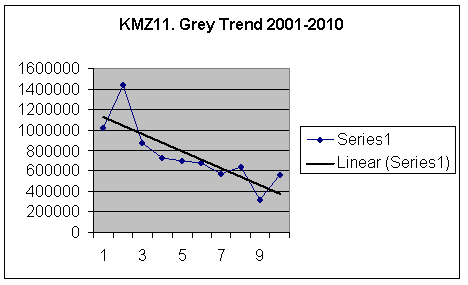
If the 1993-2000 methodology and correction factors were not valid (as seems to be the case, given they have been abandoned by the kangaroo “research” fraternity), this graph represents a 78% reduction between 2001 and 2009, which is even worse.
Indeed a halving between 2008 and 2009 is extremely alarming, taking grey kangaroos to a dangerously low level - the low count prompted managers to suspend the quota at Griffith in 2010, however an impossible increase of 75% in the following year ensured that shooting recommenced as soon as could practically be implemented (not even a 1 year cessation to shooting – they obviously could not wait to get the shooters back in the paddock).
A clear pattern is emerging. That’s the western zones. Let’s now look at the “new” harvest zones.
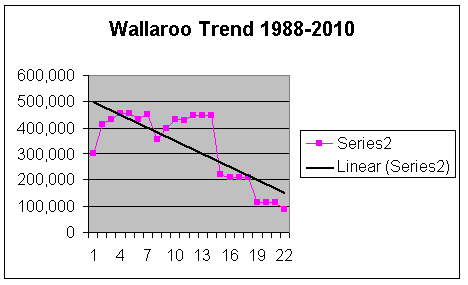
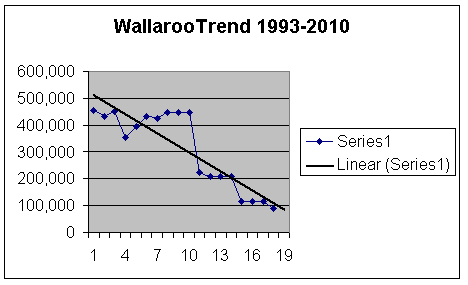
Zone 12. Armidale
Interestingly in 2011, Herbert and Elzer finally identify the fact that:
Analysis of population and harvest data for wallaroos within the Northern Tablelands of NSW suggest that the current triennial helicopter survey technique does not offer adequate precision for managing the commercial harvest of this species…
Wallaroos reduced by 70%, and not recovering – indeed their monitoring does not seem to provide adequate precision to manage the harvest. Ignore the population nearly tripling between 2003 and 2004 (biologically impossible); all the Wallaroos must have been hiding in 2003, to have provided such an anomalous data point.
If it were not for that kick at the end, this graph would probably look about right. A slow but steady slide into extinction, as a harvest rate exceeds the capacity of the population to replace itself. Let’s hope that the 40% increase 2009-2010 is not another anomalous data point.
Zone 13. Glen Innes
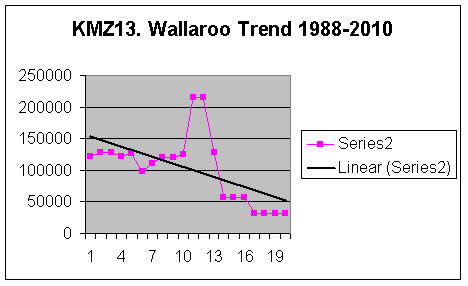
Most statistical packages will ignore a spike like that in a population study, though perhaps there is another as yet unidentified error in the monitoring methodologies.
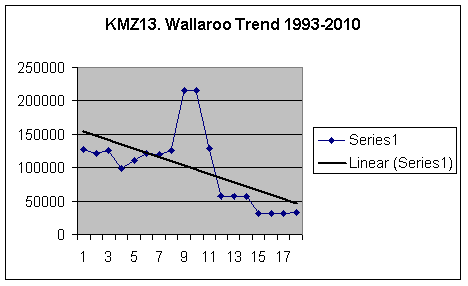
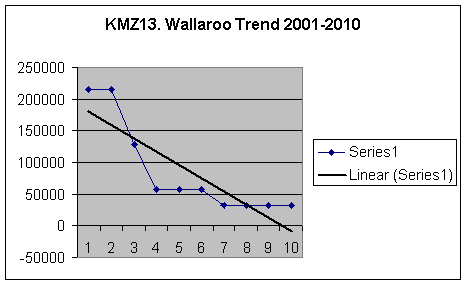
If the top of the spike was a real reflection of the Wallaroo population in the harvest zone in 2001, Wallaroos in the Glen Innes region may be faring worse than any other species, anywhere the large macropods are being shot (85% reduction in only 5 years). Harvest “managers” (OEH) do not even count them every year, despite a steep downward trend; shooting continues at 15% in 2011.
When you have graphed 10 populations of red and grey kangaroos, across 3 time scales for each species in each management area, coming to graph number 58 and having something looking like an upward trajectory raises the eyebrows. Let’s drop off the bad pre-1993 data.
Yes, that is definitely a positive trend line.
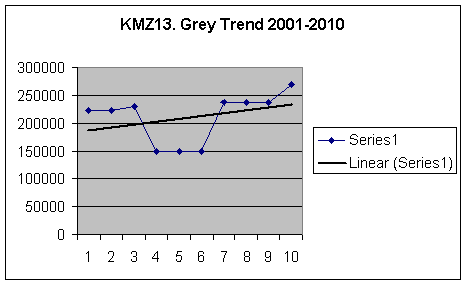
This would be a nice graph, if it is accurate.
Averaging the 58% increase between 2006 and 2007 across the period 2004-2007 provides an annual increase of nearly 20% per annum, even with shooting. Grey Kangaroos at Glen Innes are obviously an extraordinary situation (the only “increaser” so far), which deserves more study.
Frankly the author’s confidence in a rigorous and competent count being conducted has been badly shaken by the experience of examining the kangaroo management systems in place in NSW, reviewing the data, and preparing this nomination. As a consequence the author has no confidence in the graph above, which shows a positive trend.
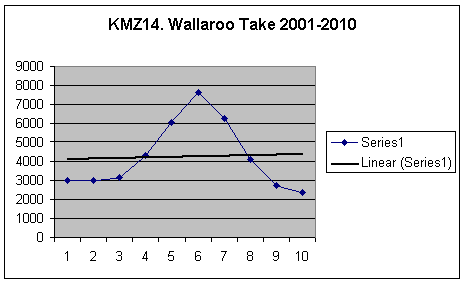
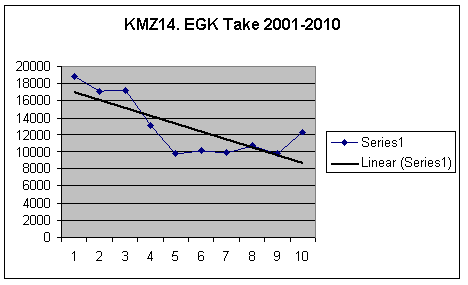
Zone 14. Upper Hunter
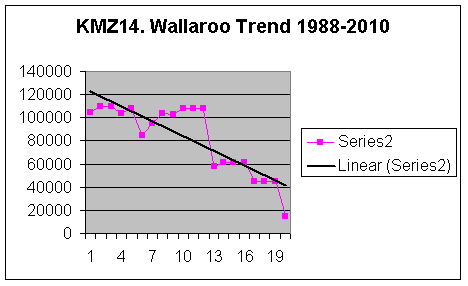
This one is obviously only going to get uglier, as we refine the data set.

Familiar territory (downward trend lines).
Wallaroos reduced by 86% between 2002 and 2010. In a timely manner, the OEH have not allocated a quota for Wallaroos in 2011 in the Upper Hunter!
Wallaroos reduced by 86% between 2002 and 2010. In a timely manner, the OEH have not allocated a quota for Wallaroos in 2011 in the Upper Hunter!
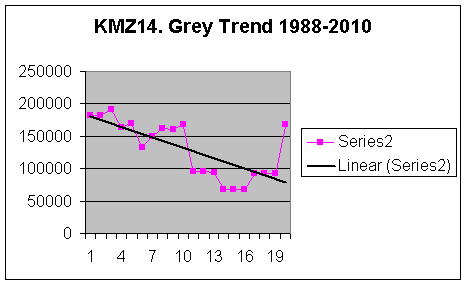
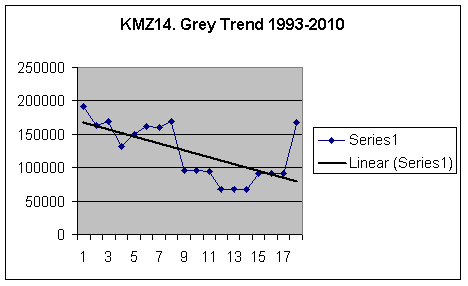
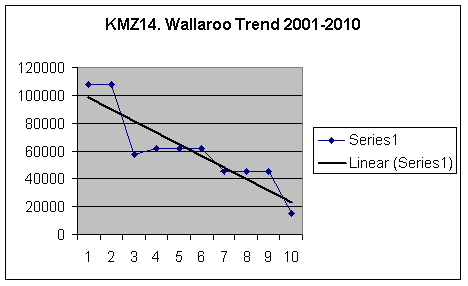
What’s going on with that kick at the end? Even if you assume that the 82% increase occurred between 2006 and 2010 (averaged over 3 years, because the managers and researchers have not bothered to count them every year), that’s still an increase of more than 27% per annum (more than double observed annual population growth rates in detailed field studies).
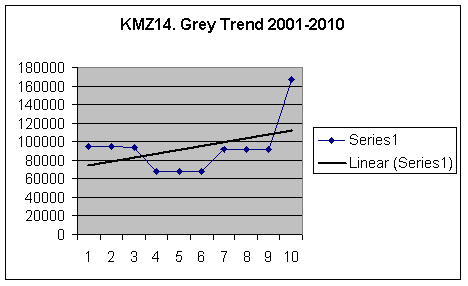
This final KMZ14 graph demonstrates what one anomalous record can do (ie: the last data point is anomalous if it’s accepted that a 27% per annum increase is biologically impossible) to a data set (positive trendline).
Given that researchers depend on funding to do these monitoring programs, and given that the kangaroo unit of the OEH is funded by tag allocations, the question must be asked: Is there any motivation for researchers and the OEH managers to inflate numbers, or even to make stuff up?
Let’s see what next year’s data looks like.
South-Eastern NSW
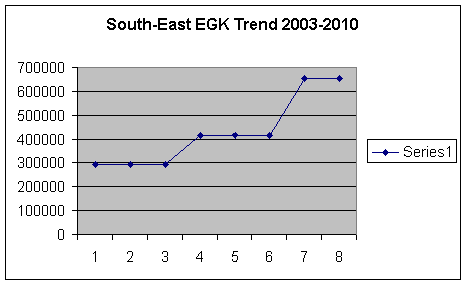
In the light of all of the above, this graph defies explanation. It runs somewhat contrary to the views I have formed on kangaroo densities on recent drives (Bathurst to Melbourne and Bathurst to Canberra), which revealed vast regions apparently devoid of kangaroos – not even roadkill.
There is a tendency in science to record the result you expect to record, particularly when the big dollars are paying for the “right” science (see “Science for Sale” below). This graph might be an example of this phenomenon – monitoring and data from monitoring programs are discussed in more detail later in this nomination.
There is a tendency in science to record the result you expect to record, particularly when the big dollars are paying for the “right” science (see “Science for Sale” below). This graph might be an example of this phenomenon – monitoring and data from monitoring programs are discussed in more detail later in this nomination.
Central Tablelands
Data deficient, as this region has just been opened as a harvest zone. Here is a picture from a farm adjacent to Winburndale Nature Reserve, in this newly opened harvest zone.
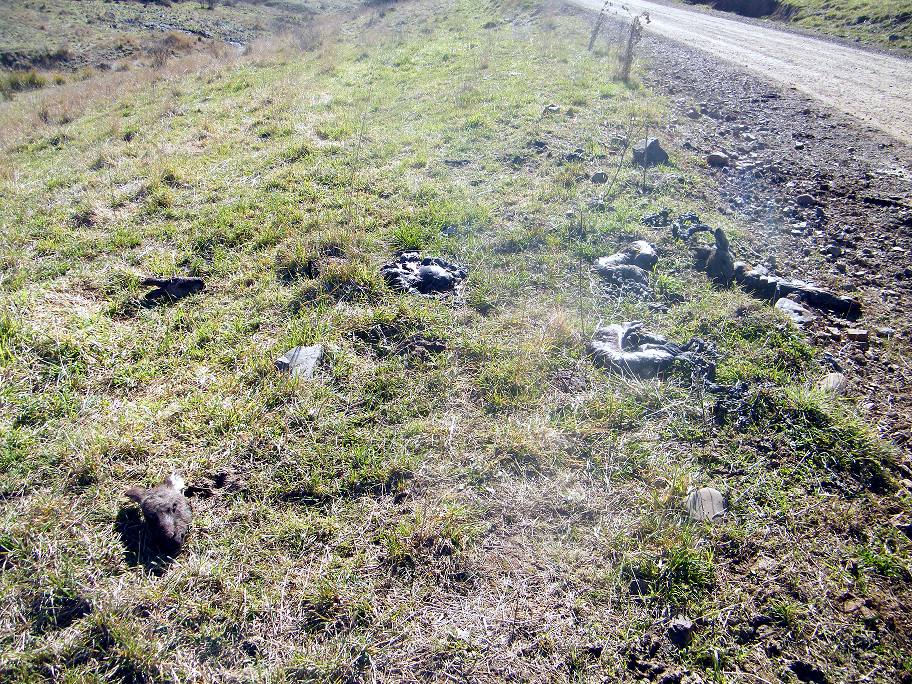
The kangaroos of Palmers Oakey meet the ruthless efficiency of the harvest industry. The same people who are supposed to be looking after kangaroos in the nature reserve, are signing the licences for the neighbours of the nature reserve to shoot them.
3.3 Species totals and trends in 2010
1. Western Grey Kangaroo
Keep in mind the same issue with dodgy pre-1993 data exists for species totals, as it did for the zone by zone accounts discussed above.
Western Grey Kangaroos were depleted by 75% from their “peak” population in 2002, in just three years. The population was almost halved in a single year (2002-2003). They have in no sense recovered in 2010. At all.
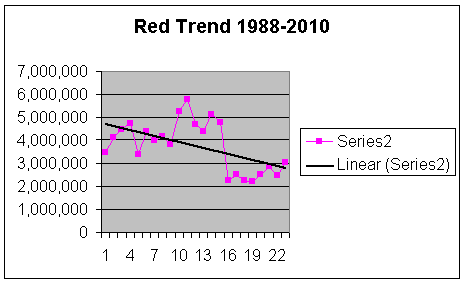
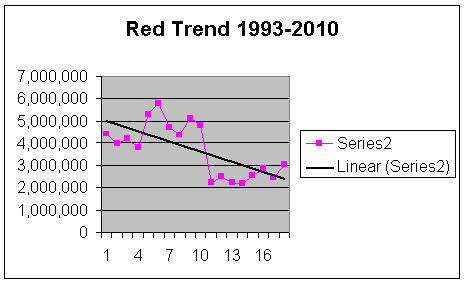
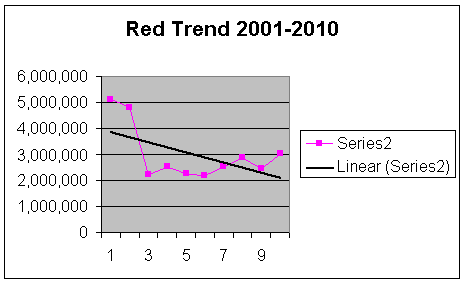
2. Eastern Grey Kangaroo
The Quota Report (DECCW 2010) figures indicate the 8M Eastern Grey Kangaroos in NSW in 2002 was the highest the population has ever been since “counting” began.
Eastern Grey Kangaroos were depleted by nearly 70% between their “peak” in 2002, and 2005, even with an additional 292,455 kangaroos being injected into the total in 2003 (SE NSW KMZ); the population was halved in a single year (2002-2003). Since 2008 nearly another 1M kangaroos from the new Central Tablelands harvest zones have been added to the “total” every year – this uncorrected data looks bad enough…
Eastern Grey Kangaroos were depleted by nearly 70% between their “peak” in 2002, and 2005, even with an additional 292,455 kangaroos being injected into the total in 2003 (SE NSW KMZ); the population was halved in a single year (2002-2003). Since 2008 nearly another 1M kangaroos from the new Central Tablelands harvest zones have been added to the “total” every year – this uncorrected data looks bad enough…
The corrected graph above illustrates that between 2002 and 2008 the populations of Eastern Grey Kangaroos in the “original” commercial harvest zones actually slumped by 80%. Since then the population has recovered to almost 40% of its 2002 total, if you can believe the recovery being shown in the most recent count data.
3. Wallaroo
The “Northern Tablelands” Wallaroo total comes from an agglomeration of animals from the Glen Innes, Armidale and Upper Hunter KMZ’s. We were all shocked to see how badly they were doing in the zone by zone account given above – it will come as no surprise that adding 3 appalling trajectories together provides a single appalling trajectory.
…dump the dodgy pre-1993 data…
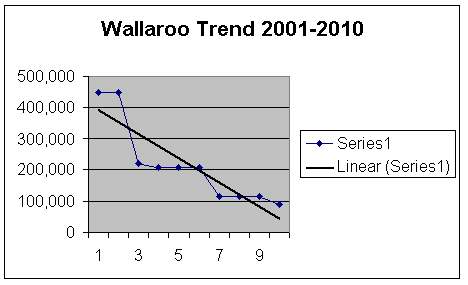
Wallaroos declined by 80% in the Northern Tablelands between 2000 and 2010. The author does not understand how people can be describing this as a sustainable industry, and is appalled that such a travesty of science, of planning, of conservation management has occurred. That such a level of incompetence from the regulating offices, with such terrible animal welfare outcomes has unfolded, to the situation today, where the author has been compelled to prepare this nomination, is outrageous.
4. Red Kangaroos
…dump the dodgy pre-1993 data…
…dump the dodgy 1993-2000 data…
Within the harvest zones Red Kangaroos were depleted by nearly 60% between their supposed “peak” in 2001, and 2003; the population was halved in a single year (2002-2003). If you can believe the figures since, numbers are slowly rebuilding, being back towards almost 60% of the numbers reported in 2001.
All of the above is based just on the raw data provided by OEH. These trends do not seem to be a matter of concern to wildlife management agencies in NSW, who are about to release the KMP 2012-2016.
The highest estimate for red and grey kangaroo “totals” is provided in the Quota report:
15 479 854 animals in 2002.
In 2010 the “total” is estimated to be 8 433 682.
Even OEH’s own figures indicate that Red Kangaroos were depleted by 60% between 2002 and 2005. In 2010, they remained at less than half of their 2002 “peak”. Raising these issues with the NPWS Rangers responsible for signing permits to shoot them: “it’s drought” (NPWS Ranger pers comm 26th January 2010 – a fitting day to discuss the demise of the nation's icon, and the NPWS role in this). The harvest and otherwise licensed (and unlicensed) shooting continues, unabated.
3.4 A sustainable harvest industry? Take says otherwise
In 2010:
Populations of western grey kangaroos in the Coonabarabran zone, and both western and eastern grey kangaroos in the Griffith zone have fallen below the threshold at which harvesting must be suspended.
In 2011:
Populations of western grey kangaroos in the Bourke and Griffith zones, both western and eastern grey kangaroos in the Tibooburra zone, and wallaroos in the Upper Hunter zone are below the threshold at which harvesting must be suspended.
If the shooting in harvest zones needs to be “suspended” because numbers of kangaroos have dropped below “thresholds”, this is hardly indicative of a “sustainable” industry, and will not please consumers, who would expect a secure supply (this is the definition of a sustainable industry, after all).
So once again we bore down into the detail – into the data. The following graphs illustrate “take” across the period 2001 – 2010. These are actual counts of kangaroos processed and reported through the harvest system. If we pretend that there were not any “extras” shot out there (mis-hit / not-recovered animals), and if we ignore how many joeys are killed as collateral damage, these graphs could even be considered to be an accurate count of kangaroos killed under the harvest program.
Populations of western grey kangaroos in the Coonabarabran zone, and both western and eastern grey kangaroos in the Griffith zone have fallen below the threshold at which harvesting must be suspended.
In 2011:
Populations of western grey kangaroos in the Bourke and Griffith zones, both western and eastern grey kangaroos in the Tibooburra zone, and wallaroos in the Upper Hunter zone are below the threshold at which harvesting must be suspended.
If the shooting in harvest zones needs to be “suspended” because numbers of kangaroos have dropped below “thresholds”, this is hardly indicative of a “sustainable” industry, and will not please consumers, who would expect a secure supply (this is the definition of a sustainable industry, after all).
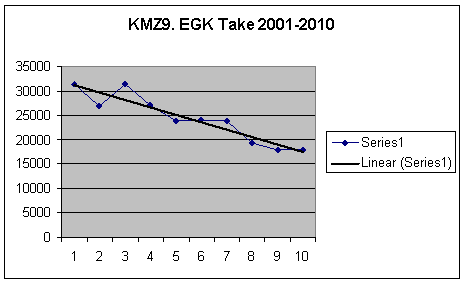
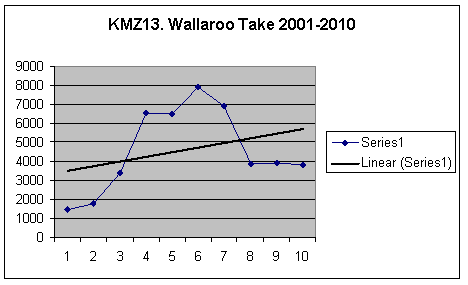
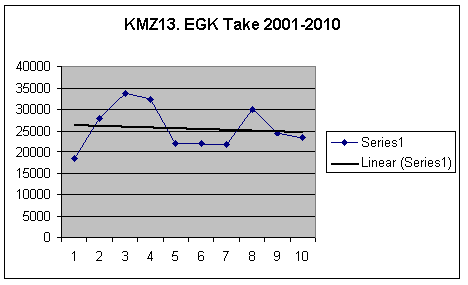
So once again we bore down into the detail – into the data. The following graphs illustrate “take” across the period 2001 – 2010. These are actual counts of kangaroos processed and reported through the harvest system. If we pretend that there were not any “extras” shot out there (mis-hit / not-recovered animals), and if we ignore how many joeys are killed as collateral damage, these graphs could even be considered to be an accurate count of kangaroos killed under the harvest program.
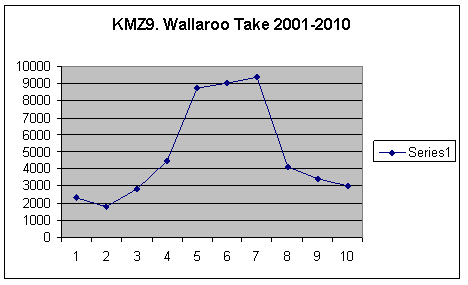
1. Tibooburra Take
A sustainable harvest? Maybe not. Quota for 2011? 108,126 Red Kangaroos. On the basis of a plummeting population at Tibooburra, I don’t think the shooters will be making this allocation.
In the first place, the harvest is in no sense limited by the quota – shooters can basically shoot as many animals as they can find. If the take is dropping, this means that kangaroos are harder to find, which is un-surprising given the reductions in populations being reported. Indeed, given that only 14.4% of the quota allocation was taken up in 2010, it may be that the population calculations are substantially more than the actual population, otherwise it would be expected that a higher proportion of the animals on offer would be killed. The percentage of the quota taken has been steadily dropping as kangaroos have become harder to find over the last few years – the shooters have in all likelihood by now moved on to better hunting grounds in the newly opened SE NSW and Central Tablelands KMZ’s.
Secondly, the harvest is given as “sustainable” at a rate of 17% (for Red Kangaroos), however in 2002, 2003 and 2006 quota allocations of 30% were provided.
While the Quota Report (DECCW 2011) suggests that the quota for 2002 of 229,200 animals is only 16.5% of the population of 754,013, clearly it is not – the Department can’t even get simple calculations right. Even pro-harvest research by Hacker et al (2004) only went as far as suggesting a 20% quota was sustainable – a 30% “quota” can only have one objective: population reduction.
In fact every single quota allocation in Tibooburra (between 2001 and 2010), as a percentage of the reported population, has been incorrectly calculated! (refer to Table 1a on page 21 of the 2011 report by OEH). For example, the uniform run of “17%” from 2004-2010 should read: 15%, 13%, 30%, 14%, 12%, 18% and 15%. This sort of sloppiness would lose marks if this was a university assignment. Why has this never been noticed?
Sustainable? Hardly. Nice that the trendline exactly tracks the reported take at the bottom.
Once again the shooting has been in no way limited by the quota – the best go the shooters had at it was in 2006, when they managed to get 84% of the allocation.
Once again the shooting has been in no way limited by the quota – the best go the shooters had at it was in 2006, when they managed to get 84% of the allocation.
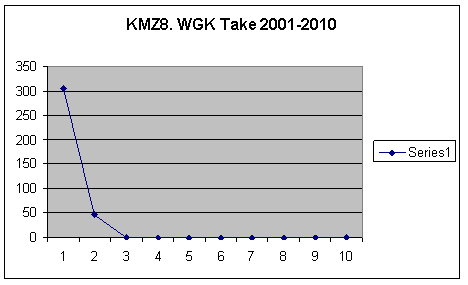
From a high “take” of 6322 in 2002, they were only able to find (shoot) 469 Western Grey Kangaroos in 2010. The industry pitches this as “they take animals well below the quota allocation”, not as “we can’t find enough kangaroos to shoot”.
Dispense with the commentary for a few pages.
Dispense with the commentary for a few pages.
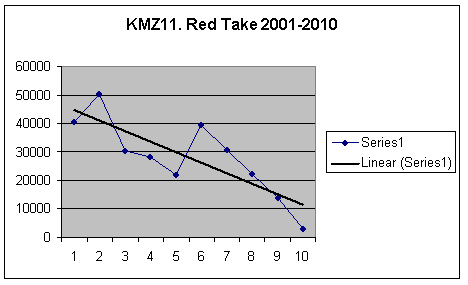
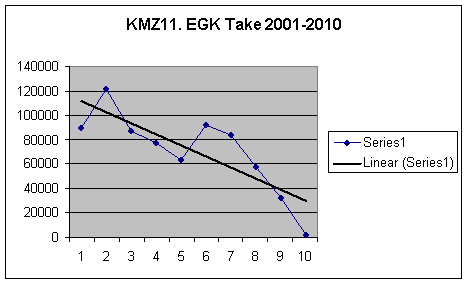
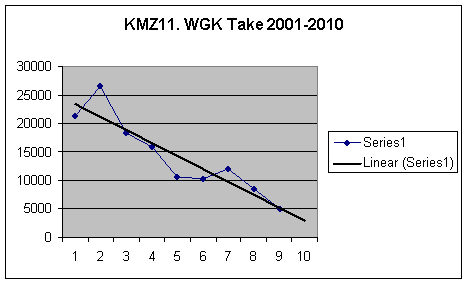
2. Bourke Take
4. Lower Darling Take
6. Cobar Take
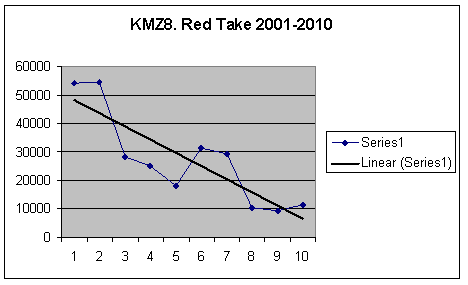
7. Bourke Take
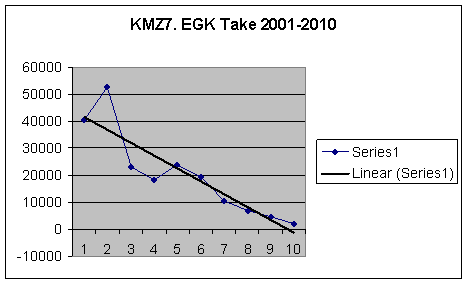
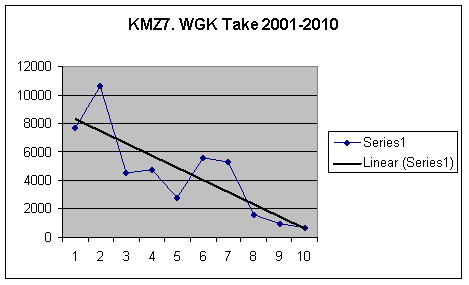
8. Narrabri Take
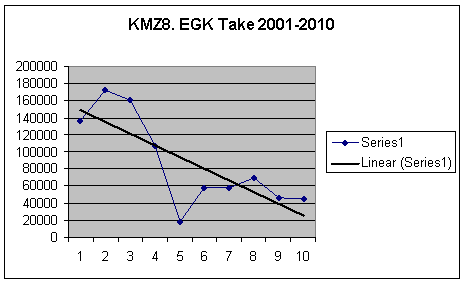
8. Narrabri Take
I don’t know if anyone will be able to explain the nearly 16,000 Western Grey Kangaroos reported as having been shot at Coonabarabran in 2006, or the 7,000 shot in 2007. Very anomalous, given the rest of the data set. Somehow a quota continues to be allocated for this species in this KMZ in 2011.
11. Griffith Take
Nice and sustainable! Even though the industry claims this is sustainable, the shooting of both Eastern Grey (graph above) and Western Grey (graph below) Kangaroos has been suspended in KMZ11 in 2011.
With this summary of take in the western zones, it is no surprise that the industry sought additional harvest zones. There are very serious looking declines in the data being reported by the industry. Combined with the dreadful data sets being obtained via “monitoring”, it defies explanation that additional harvest zones were approved. How can the Department have deemed the outcomes being presented in the data are “sustainable”, and allow this practice as acceptable “management” in new harvest zones?
A realist would think that perhaps the shooters will have largely abandoned the western zones by now, and we will see accelerated decreases in kangaroo numbers in the northern tablelands, central tablelands, hunter and south-east harvest zones over the next couple of years, coupled with increased take in these regions. Hopefully the western zone populations will recover somewhat in the absence of sustained shooting.
A realist would think that perhaps the shooters will have largely abandoned the western zones by now, and we will see accelerated decreases in kangaroo numbers in the northern tablelands, central tablelands, hunter and south-east harvest zones over the next couple of years, coupled with increased take in these regions. Hopefully the western zone populations will recover somewhat in the absence of sustained shooting.
9. Armidale Take
Does this graph show a build-up as shooters establish relationships with local landowners and gain access to properties, then a collapse as their take reduces the accessible population?
13. Glen Innes Take
14. Upper Hunter Take
This is a great graph. You can see take climb as the shooters establish their pro-shooting / harvest network. The region quickly reaches saturation, and the population crashes (shown in the previous section which discussed population trends); “take” follows the population down.
South-east NSW Take
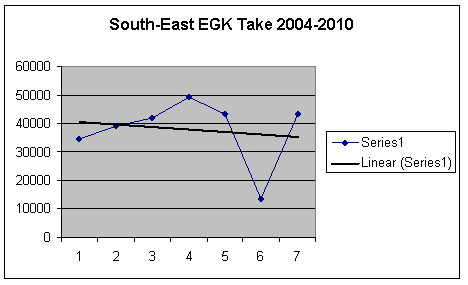
No idea what is happening here, maybe everyone shot somewhere else in 2009. The author is pretty sure that a take of 40,000 animals per year will not last forever.
Central Tablelands Take
Data deficient – they have just started. I’m imagining shooters will be gearing up in the region, and establishing local contacts.
The shooter who conducted the cull in Bathurst (see Appendix 1) was described by a neighbouring NPWS region as “trying to drum up business around here” - the average number of animals on Applications to Harm / Occupiers Licences being submitted by landholders were given to have jumped from “20 or 30”, to “200 or 300” animals, per application.
A statistician would be able to compare % take and the rate of decline of populations, and plot a trend-line to extinction.
Note that it looks like % take peaked in 2006 for all species; the author and this nomination suggest that declining populations (and decreasing densities) are reducing the % take and total take. No doubt the addition of new harvest areas will alleviate this in the shortest term - a combined “total” take (all harvest zones) is what the industry use to suggest the industry is sustainable. The kangaroos of the Central Tablelands can expect to cop it over the next few years, as the shooters who have been operating in the west descend on this new killing field. Local landholders report that shooters have been dropping contact details into letter boxes.
3.5 Disappearing Species
What has happened in harvest zones in western NSW like Broken Hill, Narrabri, and Coonabarabran, where species have dropped out of the quota?
Of these the Narrabri KMZ is the real showcase. All four species were being shot out there until 2002, when the last 46 Western Grey Kangaroos were shot. In 2003 the Wallaroo was also shot out there for the last time. Nowadays these species are not even mentioned in the Narrabri harvest zone / quota / monitoring reports – why not? If it was good enough to shoot them in 2002, and this is a sustainable industry, why isn’t this sustainable activity continuing? In fact, why are numbers not even being provided for these species in these “management” areas any more?
Of these the Narrabri KMZ is the real showcase. All four species were being shot out there until 2002, when the last 46 Western Grey Kangaroos were shot. In 2003 the Wallaroo was also shot out there for the last time. Nowadays these species are not even mentioned in the Narrabri harvest zone / quota / monitoring reports – why not? If it was good enough to shoot them in 2002, and this is a sustainable industry, why isn’t this sustainable activity continuing? In fact, why are numbers not even being provided for these species in these “management” areas any more?
3.6 Suspension of Shooting
Let’s consider now the “suspension” of shooting.
The DECCW documents do not provide details of numbers of Western vs Eastern Grey Kangaroos in many of the harvest zones, which is important if we want to understand what is going on at Coonabarabran. After one year of respite from shooting, the shooting of Western Grey Kangaroos was resumed at Coonabarabran in 2011, however no data has been provided indicating any recovery of this population. “Grey” kangaroos have apparently increased from 695,066 to 935,327 in this 1 year period - this represents a rather unlikely 34.5% population growth rate, however the proportion / number of Western vs Eastern Grey Kangaroo is not provided.
What happened at Griffith? The shooting of both Western and Eastern Grey Kangaroos was suspended for 2010 (with a “0” quota allocation), however when you look at page 28 of the 2011 Quota Report (DECCW 2010) it clearly shows that 16,673 “grey” kangaroos were still shot in 2010 at Griffith, despite the “suspension”.
Apparently they “counted” them in winter, found that the population had nearly doubled (with a reported increase of 75.3%; note this is a biological impossibility – see previous sections of this nomination), and shooting resumed in September 2010. After a nine-month respite, followed by the slaughter of 16,673 animals in the last quarter of 2010, a quota of 50,019 animals was allocated in 2011, based on monitoring “data” which is frankly not believable.
Now that shooting has “resumed” in these zones, the OEH have revised their quota to around 10% of the population at Griffith. Is the department charged with the management and conservation of Australia’s native wildlife doing guesswork? What happened to 15-17% being sustainable? Are they making this up as they go along? Are they plucking new quotas out of thin air, when something has clearly gone wrong? The OEH needs to explain why they have now allocated a 10% quota at Griffith, and describe their reasoning behind this new harvest rate, and how this reflects on the 15% (or 17%, or 30%) quotas still being allocated in other KMZs.
In 2009 the KMAP responded to a Farmers Association query, that if the harvest is stopped because of populations dropping to below “trigger points”, will this affect farmers being allowed to shoot for damage mitigation?
Non-commercial shooting would not be stopped, but the continued shooting would of course slow the recovery rate of the species.Even if numbers drop to below critical levels, farmers could continue to shoot kangaroos, for no reason? (damage mitigation is no longer a valid reason, according to the latest research – see elsewhere in this nomination). Given the lack of due diligence on the part of the licensing body (NPWS has no training, policy or procedure for allocating s. 120 and 121 licences), continuing to issue licences in “suspended” harvest areas may amount to a “mopping up” operation, on the part of landowners hostile to kangaroos.
Illegal shooting continues regardless of all discussion – there is no such thing as “suspension of shooting”.
3.7 Sustainable Kangaroo Management?
From Dawson 1995:
Graeme Caughley suggested, on the basis of a computer simulation, that a continued commercial harvest of 10-15% of the kangaroo population per year would reduce the population to 60-70% of its unharvested density.
A harvest rate equal to or exceeding the population growth rate of a species can only result in a reduced population density; if the harvest continues at a rate exceeding the population growth rate, why would the kangaroo density would only fall to 60 or 70% of the unharvested population? Wouldn’t it continue to fall?
Let’s assume for a single moment that the harvest itself as it operates is sustainable, as all the harvest advocates claim.
On top of the harvest, NPWS officers continue at a regional level to provide s. 120 and 121 licences to destroy animals, without even being aware of critical region-wide or multi-regional declines. Are these licences still handed out while the commercial harvest is suspended? Yes they are. This is hardly an environment where recovery of such a slow-breeding species seems likely.
Indeed a new concept has been added to the mix – the “Special Quota”, on top of the usual 15% or 17% quota. Apparently farmers still shoot a lot of kangaroos for the purposes of “damage mitigation” in the harvest zones, despite even the most recent review (Herbert and Elzer 2011) stating:
Beginning with the 2002-2006 KMP, there has been no reference to the culling of kangaroos on the basis of damage mitigation, as damage is difficult to monitor, predict and prove empirically…
If damage mitigation has been discarded as a reason for shooting kangaroos, what reason is being given for the destruction of animals to fill the “special” quota? You don’t need to look far; from the DECCW (2011) Annual Harvest Report (2010):
In other zones the annual harvest quota was released in stages to assist in the management of damage to winter crops and reduce non-commercial culling associated with crop protection.
…or just go to the OEH website, which still bangs on about shooting kangaroos for damage mitigation, and where you can download their “new and revised” licence-to-harm-fauna application, which includes boxes for landholders to tick, indicating various forms of damage kangaroos supposedly cause, and helpfully providing other unproven and unjustifiable “reasons” to shoot them. Or just check out the Minutes of the Kangaroo Management Advisory Panel, which frequently discusses how shooting increases as crops come on – this is what the “special quota” was developed to provide (to allow farmers to shoot animals off crops).
While it is not “a pseudo-commercial quota” according to DECCW 2011, the Special Quota does add animals to the commercial harvest (carcasses are allowed to be processed; harvest shooters are allowed to be engaged to conduct shooting programs). With regard to this, the DECC (undated) states in reference to the 15% and 17% quota allocations:
While some people [farmers] believe that these proportions are too low, any proposal to increase these proportions would need to be approved by the Commonwealth Government after appropriate public consultation. DECC has no plans to request an increase.
This is extremely disingenuous when they have previously stated that the “Special Quota for commercial KMZ’s will be sought in the annual commercial quota application to the Commonwealth”. According to the OEH this is not an increase in the quota, the animals in the “Special Quota” would have been shot anyway, under an occupiers licence for the purposes of “damage mitigation”.
What is the proportion of the population shot annually, exactly? It’s a bit hard to tell, because apparently no-one knows how many kangaroos there are, and there is no central database of occupier licence shot animals. The NPWS sure are excelling in their role as wildlife managers!
On the evidence it could be posited that the OEH-NPWS are complicit with the harvest industry to bring numbers of kangaroos in farmed areas down to levels deemed acceptable to farmers (ie: none). Kangaroo management looks like money and lobby-group driven policy, which is resulting in the world’s largest slaughter of wildlife – nothing about kangaroo “management” (harvest) is “sustainable”.
Australia – the lucky country… unless you’re a kangaroo!